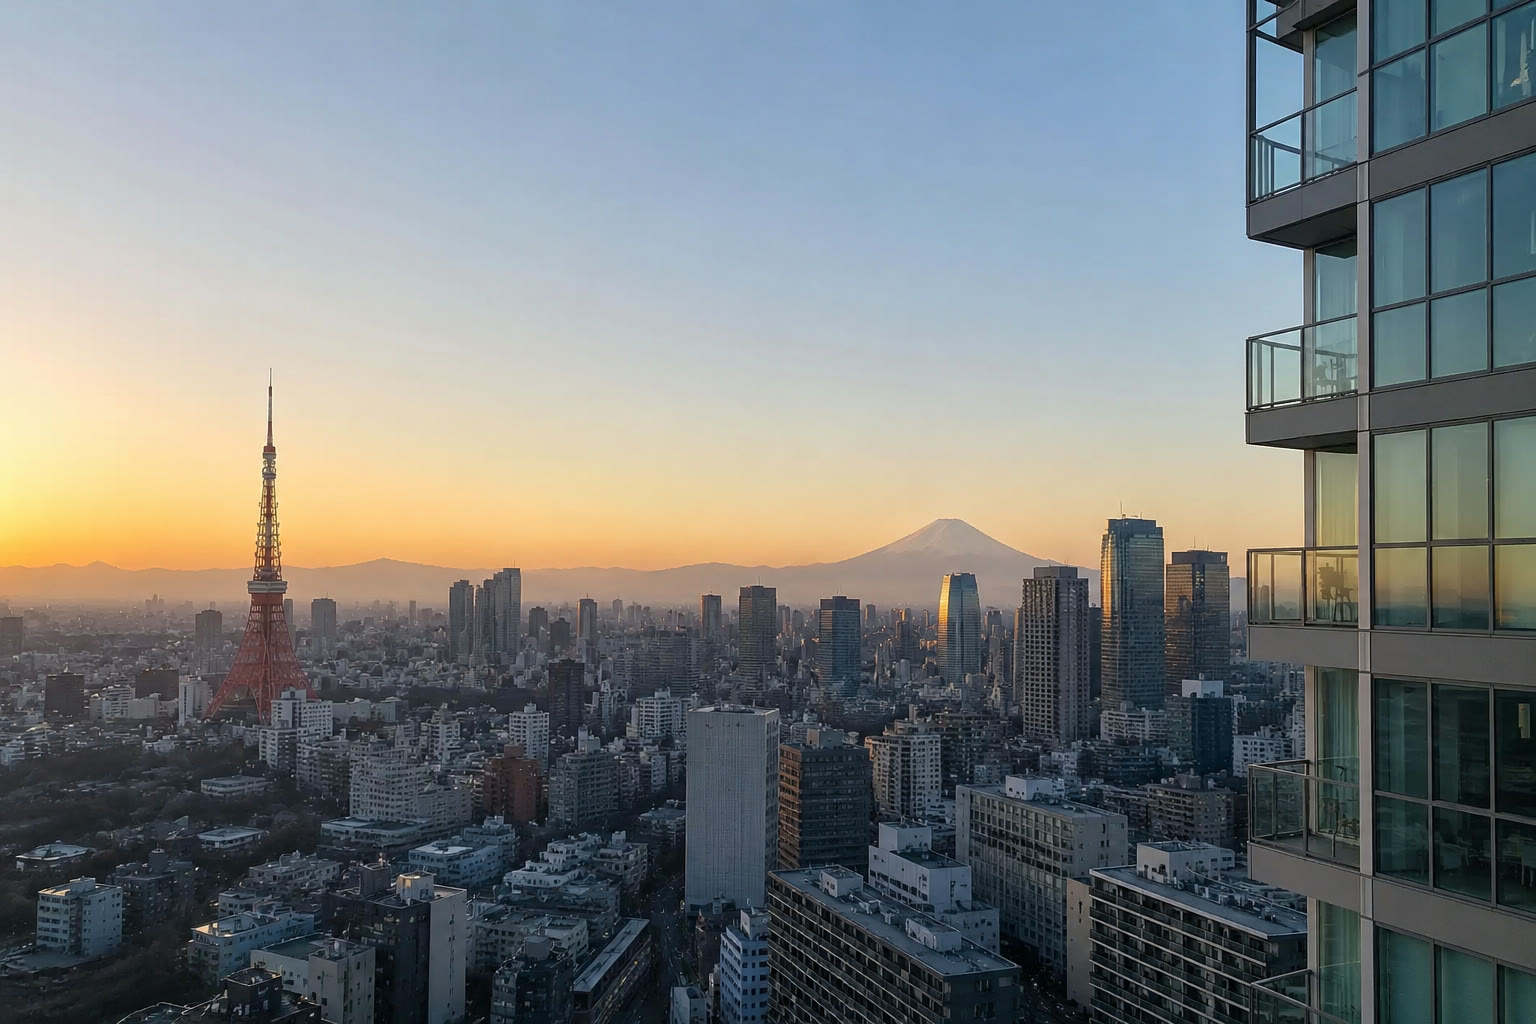
Greater Tokyo condominium prices remain close to their historic highs. Nothing in this month's data changes that: the average transaction still cleared at ¥51.3M, within a few percent of the strongest levels this market has ever recorded.
What has changed is the balance between supply and demand. Listed inventory has risen for six straight months while transactions have slowed, and the shift is heavily concentrated in Tokyo's three central wards — transactions there down 39% year-on-year against a 58% rise in inventory. For a buyer, that combination means more to choose from than at any point in the past two years, and a better position from which to negotiate. Everywhere else in Greater Tokyo, the market looks considerably steadier.
The four parts that follow set out the detail: the aggregate market, Tokyo ward by ward, the four prefectures, and how detached houses compare. Our view, at the end, is where we say what we would act on.
Greater Tokyo
The aggregate market — price, inventory and transactions for the whole metro area, plus how each of the four prefectures compares.
Market at a glance
Greater Tokyo, used condominiums, August 2026 — year-on-year change. Prices are easing from a high base while supply widens: the shape of a market rebalancing after a long run, not one in retreat.
Down 2.8% year-on-year, down 2.6% from July.
Down 3.8% year-on-year — a fourth straight monthly decline.
Down 10.5% year-on-year — a fifth straight monthly decline.
Up 8.2% year-on-year — a sixth straight monthly increase.
Three trends since January 2025
Price per sqm has been volatile rather than a clean slide; inventory bottomed last November and has climbed every month since; transactions peaked in March 2026 and have drifted lower since. Read together, these three give the clearest picture of how the market has actually been moving.
Choppy throughout — a March 2025 low, a January 2026 high, and no clean trend in between. August's ¥816K is close to where the series started.
Drifted down through most of 2025, bottomed in November, then rose every single month since — a fresh 20-month high in August.
Seasonal swings throughout, but March 2026 was the high point of the whole 20 months, and August is the low point — a meaningfully weaker second half.
Source: REINS Monthly Market Watch, January 2026 and August 2026 editions (combined for a continuous January 2025–August 2026 series; overlapping months cross-checked and matched exactly). Confirmed at the quarterly level: Q2 2026 was the first quarter with a year-on-year transaction decline in 7 quarters, and the second straight quarterly inventory increase.
10-Year Trends
The charts above cover the last 20 months. Zooming out to REINS's annual figures (2016–2025) shows the longer run they sit inside. Two metrics only: REINS does not publish an annual inventory figure, and the annual transaction count is not shown here because a REINS registration-process change effective January 2025 makes the 2025 figure not comparable to earlier years — including it read as confusing rather than informative.
Ten straight years of annual increase — up 73% over the decade, with the pace of increase itself accelerating since 2021.
A 2018 peak, a 2021 trough (the COVID-era low), a partial recovery to a smaller 2023 peak, then easing again — new listings have not kept pace with the last decade's price gains.
Source: REINS, "Greater Tokyo Real Estate Market Trends," annual report, 2025 edition (published January 20, 2026). Annual figures are not directly comparable to the monthly figures above.
Where the four prefectures stand
Closing price per sqm, year-on-year — August 2026.
Saitama and Chiba show price and transaction volume rising together — a healthier pattern than Tokyo's, where price is essentially flat but volume has fallen sharply. Kanagawa sits in between, and splits further into Yokohama/Kawasaki versus the rest of the prefecture — see the area-by-area charts later in this report for how those two are moving apart over time.
Saitama and Chiba are tracked at the prefecture level only this month; no equivalent official sub-area split exists for either.
Source: REINS Monthly Market Watch, Aug 2026.
Tokyo, Close Up
The same three metrics — price, transactions, inventory — for the three central wards, with Tokyo's other five zones summarised alongside.
Tokyo's six zones
Tokyo's 23 wards split into six traditional zones. The three central wards — where this month's movement is concentrated — are charted below; the other five follow in a single table. Closing price runs five months deep for every zone (March, May, June, July, August; April was not consistently reported across zones), inventory has two consistent readings (March and June), and transaction counts run May–August, except North (Johoku), which was only published for March, July and August.
May’s sharp trough gave way to three straight months of recovery, with August the highest of the five readings.
Two months of recovery reversed sharply in August — the sharpest single-month drop of the six zones.
Up further from March’s already-elevated level — the fastest inventory build of the six zones this stretch, consistent with the price/transaction divergence above.
The other five zones in brief, with the central wards repeated for comparison.
| Zone | Avg price, Aug | Price, Mar→Aug | Transactions, Aug | Inventory, Mar→Jun |
|---|---|---|---|---|
| Central 3 Wards | ¥141.75M | +2.5% | 154 | +11.2% |
| South (Jonan) | ¥69.95M | -10.1% | 280 | +5.5% |
| West (Josai) | ¥77.60M | -15.3% | 213 | +10.3% |
| East (Joto) | ¥59.96M | -0.1% | 359 | +7.0% |
| North (Johoku) | ¥60.78M | -2.2% | 259 | +6.3% |
| Tama | ¥38.44M | -4.2% | 297 | -4.7% |
West (Josai) has the steepest price decline of the six over these five months; Tama is the only zone where inventory fell. These are whole-property averages and move with the mix of units sold in a given month, so read them by direction rather than by level.
Price/sqm data still isn’t charted here — it isn’t published consistently across all six zones for the months above, so it will be added once coverage catches up.
Source: Diamond Real Estate Institute, monthly compilation of REINS data, reconstructed from the March, May, June, July and August 2026 editions of this series (earlier editions retrieved via the Wayback Machine, since the source page is overwritten each month rather than archived). North (Johoku) transaction counts for April–June were not published in any of the available editions. August figures were cross-checked against REINS’s own official Tama figures, which matched exactly.
Across Greater Tokyo
Price per sqm and transaction volume for every area — 23 Wards, Tama, Kanagawa (split), Saitama and Chiba.
Regional price and transaction trends since January 2025
Closing price per sqm and transaction volume, month by month, area by area — 20 months of REINS data, ordered 23 Wards, Tama, Kanagawa (split), Saitama, Chiba. One metric is missing on purpose: REINS does not publish inventory broken down by prefecture or sub-area, in either its monthly or quarterly release — only the Greater Tokyo aggregate shown earlier in this report. That is a structural gap in the source data, not an oversight here.
Climbed to a January 2026 high, then eased — August is the only month in this series where the 23-Ward price sits below its own year-ago level.
The clearest downtrend of any area here — the high came early (March 2025), and August is a fresh 20-month low, well below where the series started.
Its own path: an April 2025 low, then a choppier but clearly rising trend to a fresh 20-month high in August 2026 — the only one of these six areas still making new highs at period-end.
An early March 2025 high, then repeated swings between roughly 320 and 440 — August ends close to where the series began.
Rose to a 20-month high in April 2026, eased since — August is still above where it started in January 2025.
A sharp March 2026 spike, then a pullback — August is only slightly above where the series started.
Same shape as Yokohama/Kawasaki — an April 2026 high, a pullback since, still above its January 2025 starting point.
Same March 2026 spike pattern as the rest of Kanagawa, easing back close to its starting level by August.
Choppy but with a rising floor. January 2026 was the 20-month high; August still sits above where it started in January 2025 (¥423K).
Noisy month to month but with a rising floor into 2026 — March was the 20-month high; August is back near where the series started.
The most volatile area month to month, but with a rising trend line — June 2026 was a 20-month high.
Similar shape to Saitama — a March 2026 high, then back down to roughly its starting level by August.
Source: REINS Monthly Market Watch, area-level closing price and transaction tables, January 2026 and August 2026 editions (combined for a continuous January 2025–August 2026 series). The two editions' overlapping months (Aug '25–Jan '26) were cross-checked and matched exactly. Inventory is not published at the prefecture or sub-area level by REINS in any of its regular releases.
Asking price vs. closing price
Asking prices and closing prices have been moving in opposite directions.
Buyer takeaway: with the gap this wide, no two properties are moving the same way. Landing at the right price now depends less on the asking figure and more on reading the surrounding market and comparable closed transactions, property by property.
Asking and closing figures represent different property samples and should not be read as an average negotiation discount.
Detached Houses
The same REINS report also tracks used detached houses across Greater Tokyo — and this month, they are moving in exactly the opposite direction from condominiums.
Condominiums vs. detached houses
Everything above is about condominiums. The same REINS report, for the same month and the same region, shows detached houses moving the other way: transactions turned positive again in August, prices have risen for eight straight months, and inventory has now fallen for seven straight months — the mirror image of the condominium numbers at the top of this report.
Wherever the condominium line moves, the detached-house line moves the other way — in every one of the three headline metrics.
This isn’t a one-month coincidence. Both trends have held for most of the past year:
Condominium price growth cooled steadily from around +13% to a decline; house prices stayed positive throughout the same 13 months.
In Tokyo’s 23 wards, condominium prices fell for the first time in 76 months — while house prices in the same wards rose 4.4%.
It’s the clearest case we can point to this month: same wards, same month, and the two housing types are pricing in opposite directions. Tama doesn’t fit that pattern — condominium prices there are up 9.1% and house prices up 5.0%, both rising together, so that looks like plain area demand rather than buyers picking one format over the other. Saitama and the outer Kanagawa areas are similarly mixed. The clean version of this story is really a central Tokyo story, not a Greater Tokyo one.
Source: REINS Monthly Market Watch, August 2026 edition, detached-house sections (same report as the condominium data above). House prices are whole-property closing prices; REINS does not publish a per-sqm figure for houses, so the two series are compared only by direction and rate of change, not by price level.
Our view
Central Tokyo is the part of this report we'd actually act on. Transactions there bounced back for two months, then dropped hard again in August, while inventory has climbed every month since March — up 58% year-on-year, and concentrated in the business core rather than spread evenly across the city. Across Greater Tokyo, listings and completed sales are moving in opposite directions: asking prices per square metre are up 28.4% year-on-year while closing prices are down 3.8%. These are different samples, and the gap is not a negotiation discount. But the direction of travel is consistent — supply is accumulating faster than it is being absorbed.
Outside the core, the picture is steadier. Outer Kanagawa is up 9.0% per sqm while the Yokohama/Kawasaki core sits flat, and in Saitama price and transaction volume are rising together — the most accessible of the four prefectures per sqm, and the most ordinary pattern in this month's data. The central wards are also where condominiums and detached houses pull apart hardest: condominium prices there turned negative for the first time in over six years while house prices rose 4.4%. That is a central Tokyo pattern, not a Greater Tokyo one.
When inventory accumulates, pricing power moves toward the buyer; when it tightens, it moves back to the seller. Six straight months of accumulation, with transactions slowing at the same time, is what the beginning of a buyer’s market looks like — and it is where this market is now. That is not an argument for rushing. It is an argument that if you are in a position to buy, this is the point at which to start preparing rather than the point at which to start watching: financing arranged, the shortlist of buildings narrowed, the comparable closed transactions understood. By the time an opening is obvious to everyone, most of it has already been taken. Next month’s report is the one to read closely — September will show whether this slack is still widening or has started to close.
The supply side reinforces this over a longer horizon. Building a new reinforced-concrete or heavy-steel condominium in Japan has become materially more expensive: labour is scarce and costly, and a weak yen has carried imported material prices up with it. At today's construction costs, new projects struggle to reach yields that work — and in the locations that matter most, there is no new land. Building something new means demolishing something old first. The United States is the clearest illustration of where a long supply squeeze leads: years of constrained construction have left existing owners holding assets that absorbed inflation rather than being eroded by it. Japan's constraint arrives through cost and land rather than zoning, but it points the same way — the stock of well-located, well-built condominiums will not expand quickly.
Which is why we expect this market to separate rather than move as one. Broadly into three: locations where scarcity, brand, convenience and genuine owner-occupier demand are reinforced by international buyers, and where prices should keep rising; a much larger middle that grows slowly or simply holds its value; and regional Japan outside the major metropolitan areas, where depopulation and the cost of maintaining infrastructure will weigh on values. That last distinction is between metropolitan Japan and the rest of the country, not between central Tokyo and its commuter belt. We do not assume a world without inflation, so real assets remain worth owning — but ownership alone is not a strategy. Selection is, and so is the entry point. That is the level at which the acquisition calls, rent-setting and buy/sell timing we actually make get decided, drawing on real transaction data from an industry-only database, worked down to the specific building, unit layout, distance to the station, competing listings and building age.
Considering Buying Property in Japan?
We help international buyers evaluate, acquire and manage residential property in Japan, with attention to timing, location and long-term ownership economics.
View Properties Contact AOKI LIVING →Sources & Data Notes
Primary source. Monthly and quarterly Market Watch, closing prices, transactions, aggregate inventory, for both condominiums and detached houses. Data: August 2026 (monthly), Q2 2026 (quarterly cross-check).
Tokyo 6-zone breakdown, compiled monthly from REINS data at a fixed URL. Data: August 2026.
Closing-price data (REINS, Diamond Real Estate Institute) and asking-price data are methodologically distinct and are never presented as equivalent. Figures reflect the most recent publications available at time of writing and may be revised by their publishers. Saitama and Chiba are reported at the prefecture level only; no official or reliably recurring sub-area breakdown exists for either at this time.
This report reflects market aggregates and does not constitute a valuation of any individual property. It is provided for general information only and does not constitute investment, legal, tax or financial advice. Past performance does not guarantee future results.