Japanese property listings often begin with headline yield: annual rent divided by purchase price.
For U.S. and overseas investors, that number is only the starting point. The more useful underwriting question is what remains after property-level ownership and operating assumptions are applied.
This article shows how Japanese headline yield can be translated into a simplified NOI-like owner-side yield before financing and income tax.
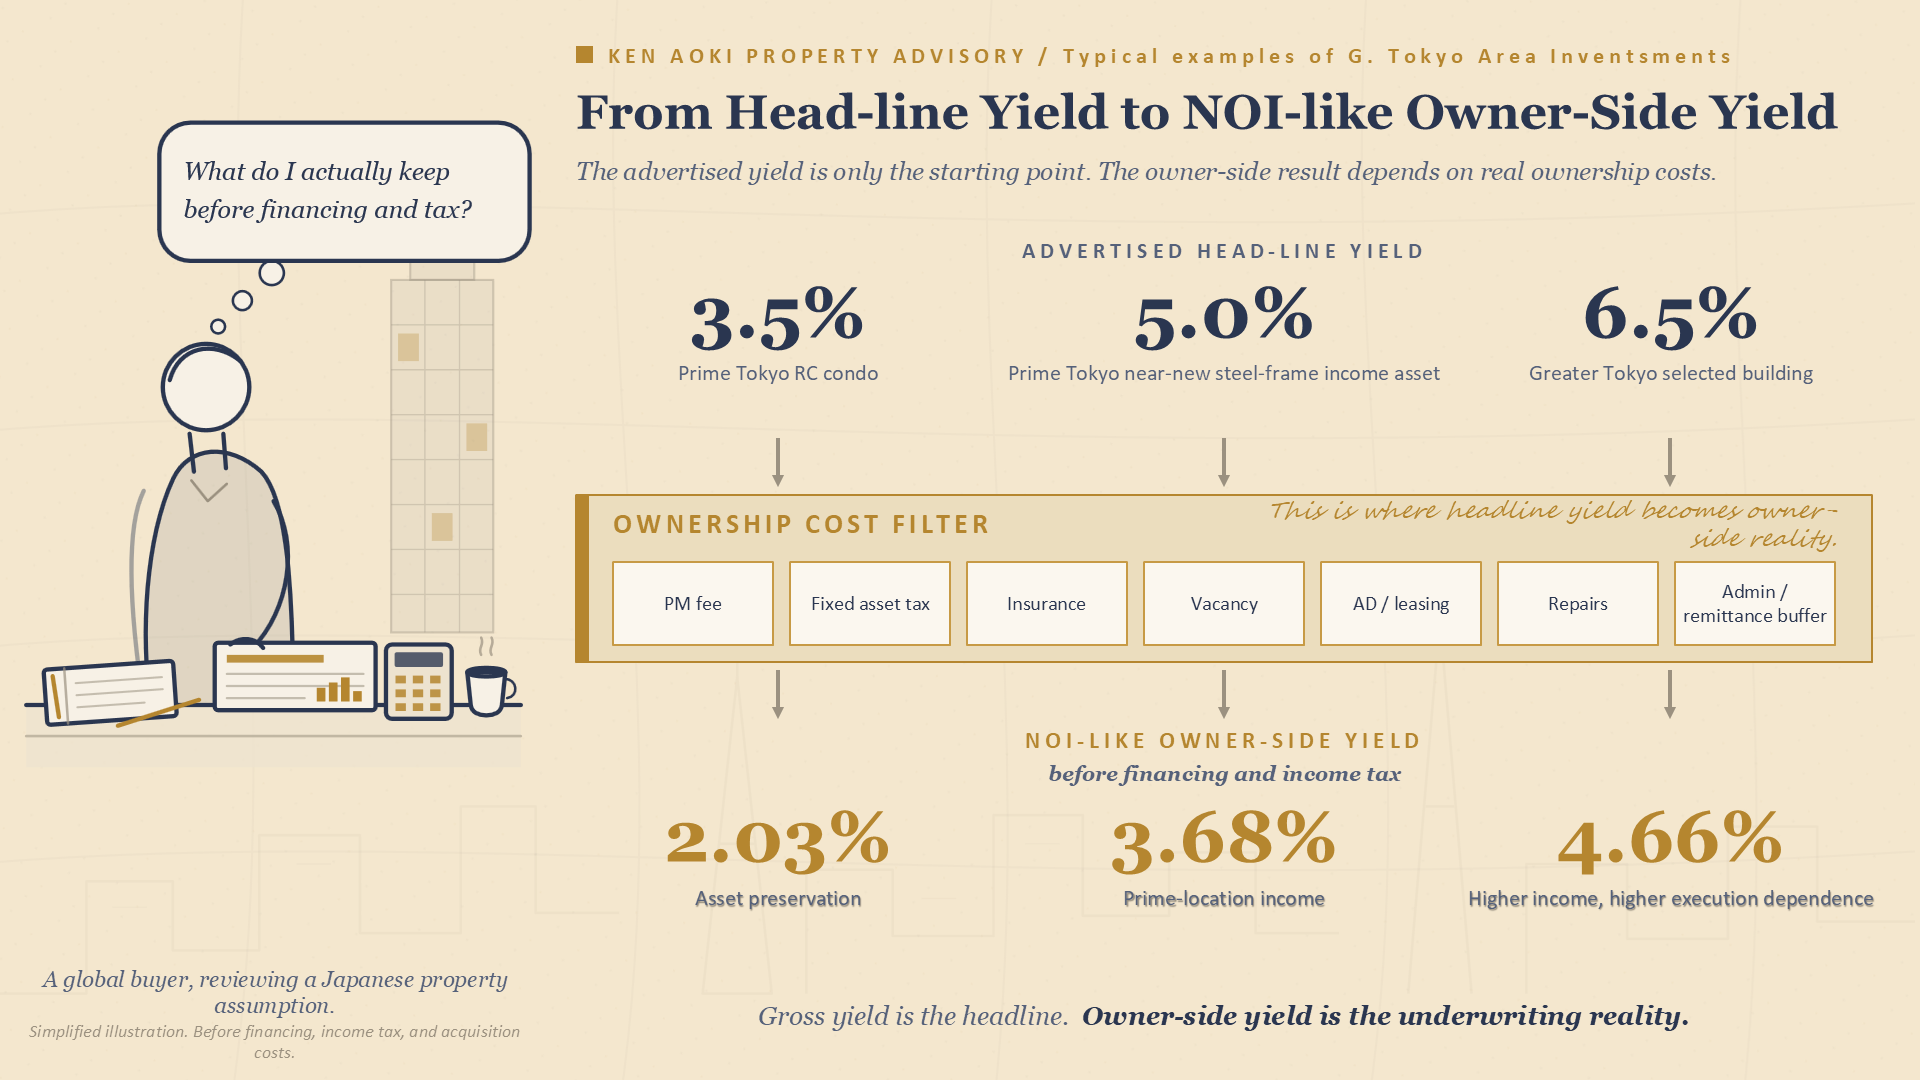
The purpose of this illustration is not to forecast returns. It shows how the same headline budget can represent different ownership realities. A 3.5%, 5.0%, and 6.5% headline yield each belong to a different strategy — and each translates into a different NOI-like owner-side result.
To move from headline yield to NOI-like owner-side yield, this article deducts simplified property-level assumptions: property management fees, fixed asset and city planning tax, insurance, vacancy, AD / leasing reserve, minor repairs, and administration / remittance buffer.
The result is a simplified NOI-like owner-side result before financing and income tax. It is not formal NOI, a forecast, or a guaranteed cash-flow result.
Three Investor Patterns — Same JPY 100 Million Budget
How to read the assumptions
Vacancy, AD/leasing, and minor repair costs are shown as annualized percentages of gross annual rent. A prime Tokyo condo may have lower vacancy, fewer tenant changes, lighter AD burden, and smaller in-unit repair friction. A whole building has more rooms, so some tenant turnover should be expected.
For the whole-building examples, this article assumes new or near-new assets. Major repair reserves are not included in this early-stage illustration. The purpose is not to make Japanese real estate look unattractive — it is to translate headline yield into owner-side reality.
Prime Tokyo RC Condo
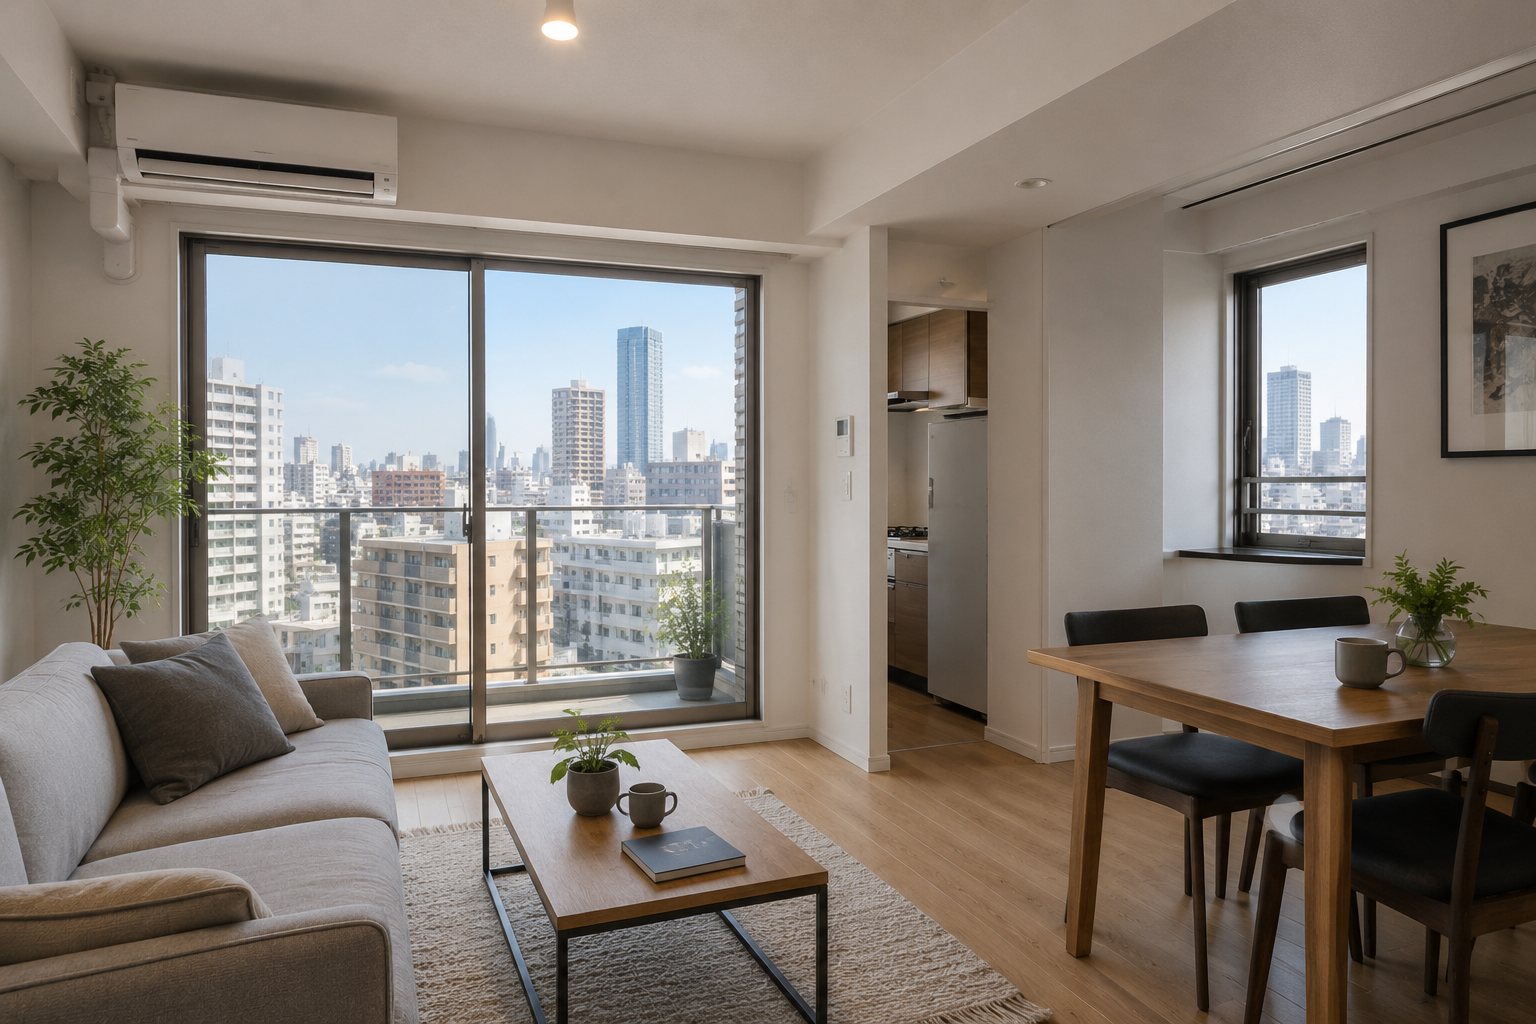
RC Condominium
Prime Tokyo condominium — private use, Japan base, and asset preservation.
A prime Tokyo RC condominium is not usually purchased for maximum income. Its main purpose may be capital preservation, inflation protection, inheritance planning, future personal use, stable rental income, or long-term urban exposure.
For successful Japanese investors, this is often an asset preservation strategy.
The yield is not high, but the asset may be easy to understand, easy to rent, easier to hold, and easier to exit compared with weaker locations.
The buyer may prioritise:
- Capital preservation
- Inflation protection
- Inheritance planning
- Future personal use
- Stable rental income
- Long-term urban exposure
| Item | Amount | Assumption / Note |
|---|---|---|
| Headline annual rent | JPY 3.50M | 3.5% on JPY 100M |
| Property management fee | − JPY 0.18M | approx. 5.0% of rent |
| Condo management fee / repair reserve | − JPY 0.60M | approx. JPY 50,000 / month |
| Fixed asset / city planning tax | − JPY 0.30M | assessed-value based |
| Insurance / accounting / remittance buffer | − JPY 0.15M | annual buffer |
| Vacancy reserve | − JPY 0.09M | approx. 2.5% of rent; low-vacancy central-demand assumption |
| AD / leasing reserve | − JPY 0.05M | approx. 1.5% of rent; light tenant-replacement assumption |
| In-unit minor repair / turnover buffer | − JPY 0.10M | approx. 3.0% of rent |
| Illustrative NOI-like owner-side result | JPY 2.03M | before financing and income tax |
| NOI-like owner-side yield | approx. 2.03% | on purchase price |
How to read this asset:
A 3.5% headline yield on a prime Tokyo RC condo may become approximately 2.0% NOI-like owner-side yield before financing and income tax. That is not a high-yield story — it is a defensive urban asset story.
The attraction is not only income. It is the combination of steady rent, location quality, asset preservation, inflation resistance, and future flexibility. For some buyers, especially globally mobile private clients or families with Japan exposure, this may be a rational asset.
Prime Tokyo Near-New Steel-Frame Building
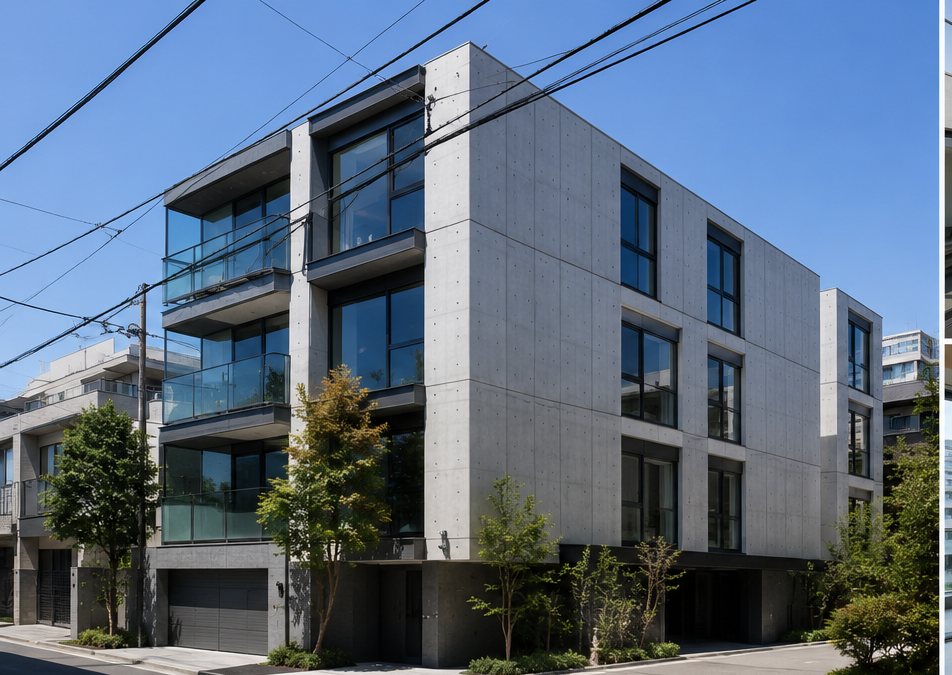
residential asset
Prime Tokyo income asset — central location, S-structure quality.
This is one of the most attractive categories when selected properly. A 5.0% headline yield may look lower than a 6.5% Greater Tokyo asset — but if the property is a near-new steel-frame building in a prime Tokyo location, the yield must be read differently.
The value is the combination of prime location, stable rental demand, stronger land value, better exit liquidity, financeability, manageable building condition, lower early-stage repair burden, and income with asset-quality defense.
This is not maximum-yield investing. It is prime-location income investing.
The buyer should look at:
- Land value and location strength
- Station access and rental demand depth
- Building age and S-structure quality
- Rent sustainability and financing terms
- Management simplicity and exit buyer pool
| Item | Amount | Assumption / Note |
|---|---|---|
| Headline annual rent | JPY 5.00M | 5.0% on JPY 100M |
| Property management fee | − JPY 0.25M | approx. 5.0% of rent |
| Fixed asset / city planning tax | − JPY 0.45M | assessed-value based; prime Tokyo ownership cost |
| Insurance / accounting / remittance buffer | − JPY 0.20M | approx. 4.0% of rent |
| Vacancy reserve | − JPY 0.18M | approx. 3.5% of rent; strong-location assumption |
| AD / leasing reserve | − JPY 0.10M | approx. 2.0% of rent; light annualized leasing friction |
| Minor repair / turnover buffer | − JPY 0.15M | approx. 3.0% of rent; near-new S-structure assumption |
| Illustrative NOI-like owner-side result | JPY 3.68M | before financing and income tax |
| NOI-like owner-side yield | approx. 3.68% | on purchase price |
How to read this asset:
A 5.0% headline yield on a prime Tokyo near-new steel-frame building may translate into approximately 3.7% NOI-like owner-side yield before financing and income tax. That can be a strong story — not because 5.0% is high, but because 5.0% in the right location, with the right structure, may be more valuable than a higher headline yield in a weaker asset.
A weak 5.0% asset is mediocre. A prime-location 5.0% steel-frame building can be excellent. This is one of the areas where Ken Aoki Property Advisory can add clear value: selecting income assets where yield, location, financing, and future exit still work together.
Greater Tokyo Selected Building
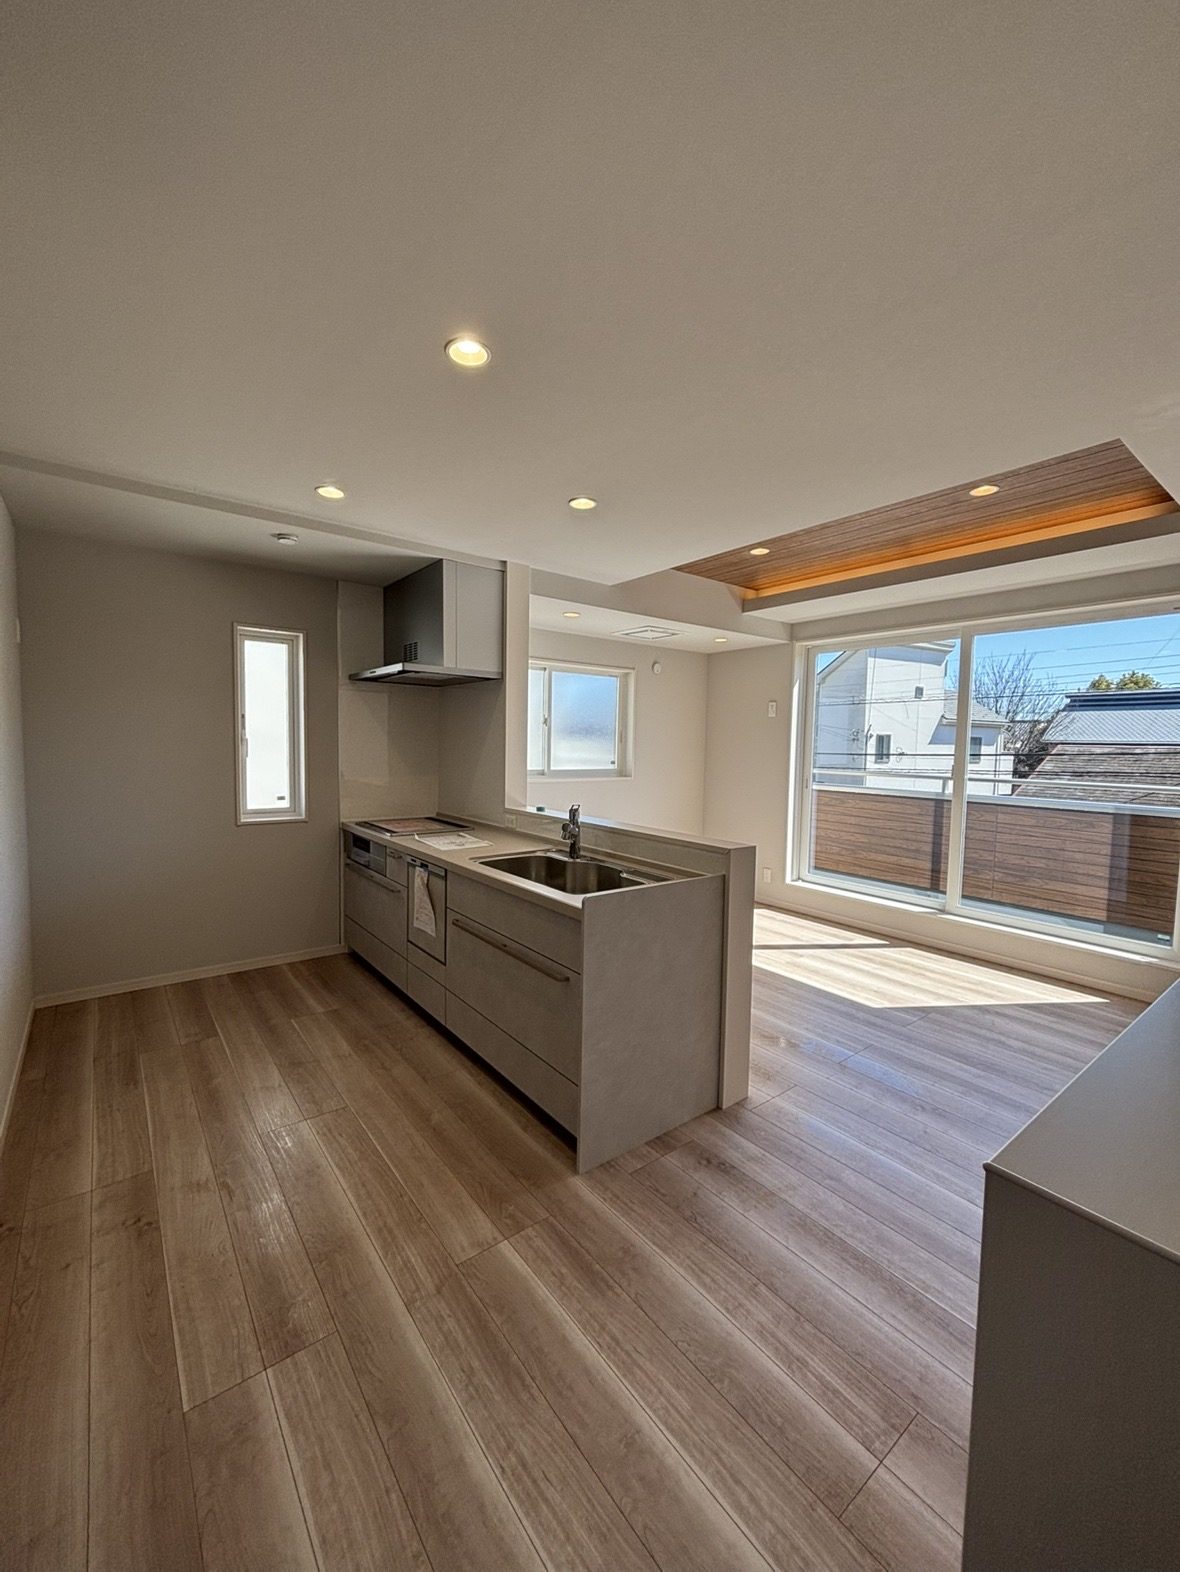
selected building
Greater Tokyo selected residential building — income-property example.
This is the zone where many serious Japanese investors and wealthy individuals focus. When financing is used, a low-yield asset may not create enough spread after debt service — which is why many income-focused investors look for assets around 6% or higher, depending on location, financing terms, building quality, and risk.
But the higher yield is not free. The investor must judge:
- Location and yield balance
- Building condition and tenant demand
- Ease of leasing and station strength
- Land value and town strength
- Financeability and exit buyer pool
For skilled investors, this is where asset selection and financing strategy matter most.
| Item | Amount | Assumption / Note |
|---|---|---|
| Headline annual rent | JPY 6.50M | 6.5% on JPY 100M |
| Property management fee | − JPY 0.33M | approx. 5.0% of rent |
| Fixed asset / city planning tax | − JPY 0.45M | assessed-value based |
| Insurance / accounting / remittance buffer | − JPY 0.20M | annual buffer |
| Vacancy reserve | − JPY 0.33M | approx. 5.0% of rent |
| AD / leasing reserve | − JPY 0.20M | approx. 3.0% of rent; annualized leasing friction |
| Minor repair / turnover buffer | − JPY 0.33M | approx. 5.0% of rent; small turnover items only |
| Illustrative NOI-like owner-side result | JPY 4.66M | before financing and income tax |
| NOI-like owner-side yield | approx. 4.66% | on purchase price |
How to read this asset:
A 6.5% headline yield on a selected whole-building asset may become approximately 4.7% NOI-like owner-side yield before financing and income tax. This can be attractive — but it is not a beginner's shortcut. The story is: higher income, higher execution dependence.
Professional investors do not simply buy the 6.5% number. They underwrite why the yield exists, whether the rent is sustainable, whether financing can be structured, and whether the exit remains credible. This is where Ken Aoki Property Advisory can add value: not by chasing high yield, but by combining property selection, financeability, operating realism, and owner-side perspective.
Reading the Yield More Carefully
The practical question is not only whether the headline yield looks high. The question is what remains after property-level assumptions are applied.
For U.S. readers, the 2.03%, 3.68%, and 4.66% figures are closer to a NOI / cap-rate-style view than to the advertised headline yield.
That is the purpose of this article: to move from headline yield to a simplified NOI-like owner-side view.
Questions to Clarify Before Comparing Yields
- Which investment pattern does this property belong to?
- Is the purpose asset preservation, income, or balanced ownership?
- What is the headline gross yield based on?
- What assumptions are used for vacancy, AD / leasing, and repairs?
- What would the NOI-like owner-side result look like before financing and income tax?
- Are major repair reserves excluded because the asset is new or near-new?
- Can the property support financing under realistic assumptions?
- Who is the likely exit buyer?
- Would the asset still make sense if the operating result is lower than the headline number suggests?
Headline yield is the visible ratio. It does not explain the asset type, operating assumptions, financing fit, repair burden, or exit buyer pool.
For overseas buyers, the useful question is not only whether the headline yield looks attractive. It is how the advertised number translates into a NOI-like owner-side result under realistic assumptions.
This article is intended as a practical reference for reading Japanese yield more carefully before comparing assets.
If you would like to discuss a specific property or ownership scenario, you are welcome to reach out directly.
Request Consultation- Real Estate Fair Trade Council — Real estate advertising rules on yield display https://www.rftc.jp/webkanri/kanri/wp-content/uploads/2019/02/h_sekoukisoku.pdf
- Tokyo Metropolitan Taxation Bureau — Fixed asset tax and city planning tax https://www.tax.metro.tokyo.lg.jp/kazei/real_estate/kotei_tosi
- National Tax Agency — Real estate income and necessary expenses https://www.nta.go.jp/taxes/shiraberu/taxanswer/shotoku/1370.htm
The NOI-like owner-side results shown in this article are simplified operating illustrations under stated assumptions. They should not be read as formal NOI, forecast NOI, projected net income, expected cash flow, market averages, underwriting standards, or investment recommendations.
This article is for general orientation only and does not constitute legal, tax, immigration, lending, accounting, property management, financing, or investment advice. The JPY 100 million examples and yield illustrations are simplified owner-side examples. The three examples assume no financing, no income tax, and no acquisition costs. Whole-building examples assume new or near-new properties and do not include major repair reserves in the early-stage illustration. Actual rents, vacancy, property management fees, taxes, insurance, repair costs, leasing costs, accounting costs, remittance costs, financing costs, tax treatment, and net income depend on the property, location, tenant profile, contract terms, management structure, owner status, lender terms, and timing. Brokerage-related matters are handled through RE/MAX INTERFACE where applicable. Tax, legal, accounting, lending, property management, financing, and other regulated matters should be confirmed with qualified professionals. No investment return, financing approval, occupancy, rent level, tax treatment, resale value, or cash-flow result is guaranteed.
© 2026 Ken Aoki Property Advisory. All rights reserved. Unauthorized reproduction, redistribution, or republication of this article without prior written permission is prohibited.